Connecting the Senses of Hearing and Vision
St. Pölten UAS Researchers Combine Human Hearing and Seeing for Data Analysis

In the project SoniVis, researchers of the St. Pölten UAS are developing a framework to combine auditive and visual data analysis. In order to allow humans to understand and interpret large and complex data volumes, contents are to be processed in a graphic and auditory manner. The new prototype SoniScope assists data scientists in their work.
Evaluating data entails many steps that cannot be fully automated but often require the expertise of humans. These data analysis activities are supported in the research fields of information visualisation and sonification – in other words, the representation of data through sounds. As data volumes and complexity are increasing, however, both approaches are reaching their limits when applied individually. For two years now, the team of SoniVis, a project of the St. Pölten UAS, has been working on audiovisual data analysis tools that combine seeing and hearing. At the end of June, the SoniScope was presented – a prototypical analysis tool that is available as free and open-source software as well.
“The volume and complexity of data are constantly growing and it is up to us to understand and analyse them. The aim of the project SoniVis is to bridge the gap between sonification and visualisation, thereby laying the foundation for a common design theory for audiovisual analytics that brings together the visual and auditory channels. To this end, the project combines competencies from the fields of information visualisation and sonification”, explains project manager Wolfgang Aigner from the Institute of Creative\Media/Technologies at the St. Pölten UAS.

Closing a Research Gap
Although numerous studies have examined either the auditory or visual representation of data, there have been very few attempts at combining the two channels.
“We lack approaches to data analysis that combine the two channels and take their mutual impact into account. So far, the research has been focussed on the auditory channel, while neglecting the visual aspect, and vice versa. As a consequence, there is no established methodological approach to combining information visualisation and sonification in the form of a complementary design theory to date”, emphasises Wolfgang Aigner.
Interactive Lens as Prototype

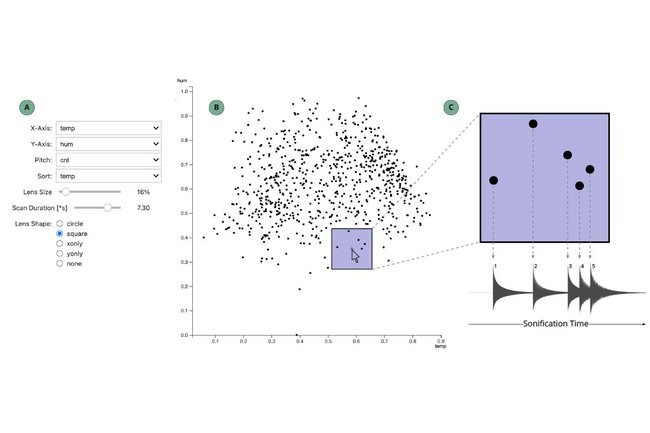
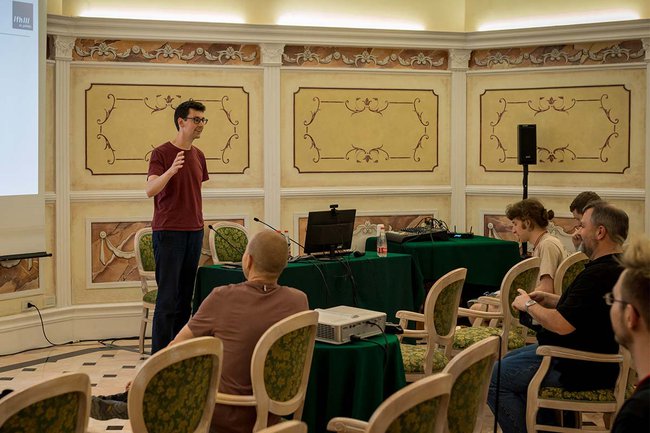
At the practical, empirical level, the researchers are taking an audiovisual approach to data analysis with the SoniScope. This prototype uses an interactive lens to identify the otherwise hidden variables of data and patterns, not unlike a stethoscope. The SoniVis team developed a prototype that runs within a Jupyter notebook – a browser-based interactive platform – and assists data scientists in their analysis of data. This prototype is also available in the form of free and open-source software. In mid-June, Junior Researcher Kajetan Enge presented the current state of the concept and prototype development at the EuroVis conference in Rome.

Internationally Connected
Forming and cultivating international networks of sonification and visualisation researchers is another focus of the SoniVis project. For this purpose, the Audio-Visual Analytics Community was founded together with leading researchers of the University of Music and Performing Arts Graz, Linköping University, the Georgia Institute of Technology, and the University of Maryland. In this context, three scientific workshops have been held so far within the framework of the AudioMostly Conference 2021, the IEEE Visualization Conference 2021, and the Advanced Visual Interfaces 2022 Conference.
Further Information on the SoniVis project
- Learn more about SoniVis – the project financed by the Austrian Science Fund (FWF).
- Protoype SoniScope software
- Publication on the EuroVis Conference 2022 in Rome
- More about the Audio-Visual Analytics Community
