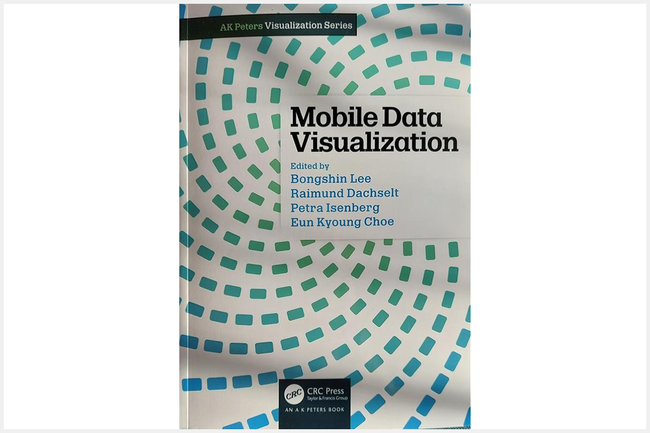
New Book: Mobile Data Visualization
St. Pölten UAS Researchers Involved in Specialist Publication; Book out now
The specialist publication "Mobile Data Visualization", which has been out since the end of 2021, is the first to provide an overview of how to effectively visualise, analyse, and communicate data on mobile devices.
Drawing from the expertise, research, and experience of an international group of academics and practitioners from across the domains of Visualisation, Human-Computer Interaction, and Ubiquitous Computing, the book explores the challenges of mobile visualisation and explains how it differs from traditional data visualisation.
It highlights opportunities for reaching new audiences with engaging, interactive, and compelling mobile content.
Among the authors are
- Wolfgang Aigner, Head of the IC\M/T and renowned expert in the fields of information visualisation and visual analytics, and
- Magdalena Boucher, junior researcher in the Media Computing research group.
In nine chapters, the book presents interesting perspectives on mobile data visualisation including:
- how to characterise and classify mobile visualisations;
- how to interact with them while on the go and with limited attention spans;
- how to adapt them to various mobile contexts;
- specific methods on how to design and evaluate them;
- reflections on privacy, ethical and other challenges,
- as well as an outlook to a future of ubiquitous visualisation.
In the following, we would like to briefly present the two chapters that Aigner and Boucher contributed to.
Chapter 2: Responsive Visualization Design for Mobile Devices
The term responsive describes aspects of a visualisation that automatically adapts to changes in, for example, device characteristics, environment, usage context, or data.
The chapter discusses aspects of responsive mobile data visualisation, and summarises the types of change that a visualisation must respond to and how they can be sensed on mobile devices. Ten responsive visualisation design strategies are reviewed, including adaptations of scale, layout, and visual encoding, as well as attentional cues and specific interactions.
The chapter concludes with future research directions pertaining to responsive visualisation design for mobile devices and beyond.
Chapter 4: 3D Mobile Data Visualization
This chapter surveys the space of three-dimensional (3D) mobile visualisations, that is, 3D abstract or spatial data on mobile 2D displays or 3D head-mounted displays.
As a playful "case study", a scenario from the film Aliens is used, where the marines are overrun by aliens on the ceiling, as their mobile visualisation device fails to show them the height dimension of the space around them. This example is used to illustrate how different mobile and 3D interaction techniques could have prevented the misunderstanding, using both hypothetical descriptions of the improved movie action and a scientific discussion of these scenarios and their implications.
Added Value for Students
"Mobile Data Visualization" is published by Chapman and Hall/CRC and is already commercially available. Lecturers and students of the St. Pölten UAS can soon borrow the book from the UAS library.

FH-Prof. Priv.-Doz. Dipl.-Ing. Dr. Wolfgang Aigner , MSc
Deputy Head of Faculty of Engineering and Business
